Finding Sources of Slowness
Up on the monitoring page requests pause,
Out jumps Good Old Slow WHERE Clause
Down through the logs with lots of ideas
Looking for the little ones, Performance joys
The Performance Song
Naughty or Nice?
So how do you go about figuring out which parts of your stack are on Santa's naughty list? Well you have to measure things of course! Now most people start to tune out here and think monitoring and measuring are hard or that it's ops' problem. But it doesn't have to be that hard! Here is list of resources to helping you find your naughty bits.
HTTP
The two easiest tools to use for finding areas where you can improve things are YSlow and Chrome's Developer Tools.
YSlow
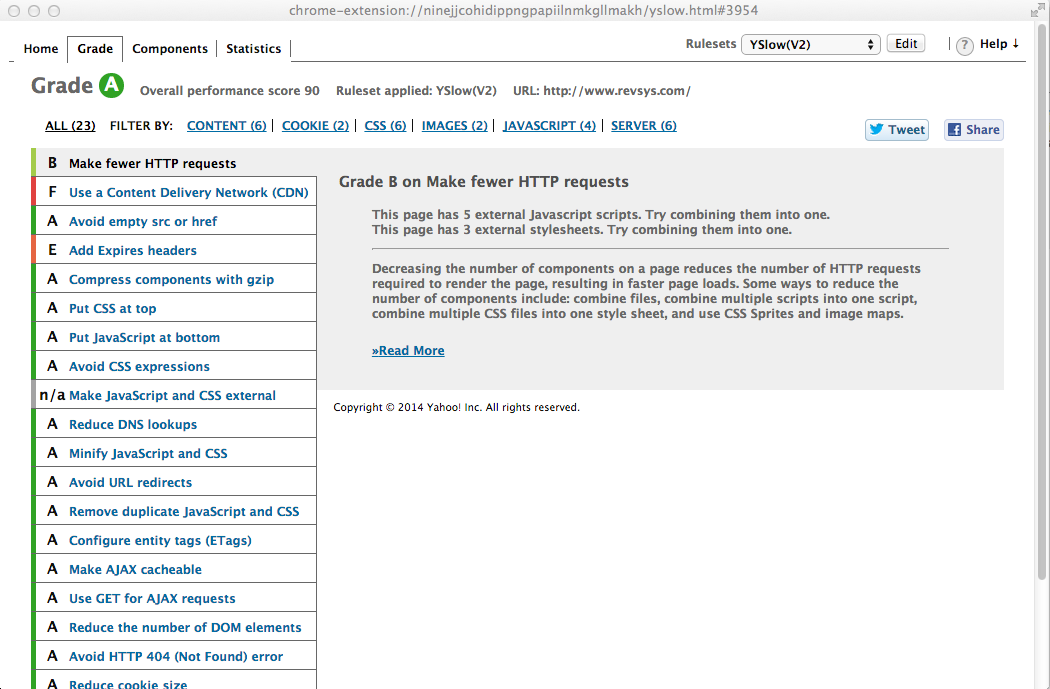
YSlow was one of the first easy to use tools for checking that you're doing most of the stuff we recommended in Day 1. It's a plugin and supports all the major browsers.
You just browse to your site, click the YSlow icon, and in a couple of seconds to gives you a alphabetical and numerical score for your site. The image above is YSlow's take on the revsys.com homepage.
For each area it tells you what it sees that you're doing wrong and links off to helpful information on how to fix it. Now, don't get all obsessed with the grade it gives you. If you get an A or a B, consider yourself good and move on. If you get a C or lower, you should definitely tackle a few of the easier to implement fixes and enjoy a faster site.
Chrome Developer Tools
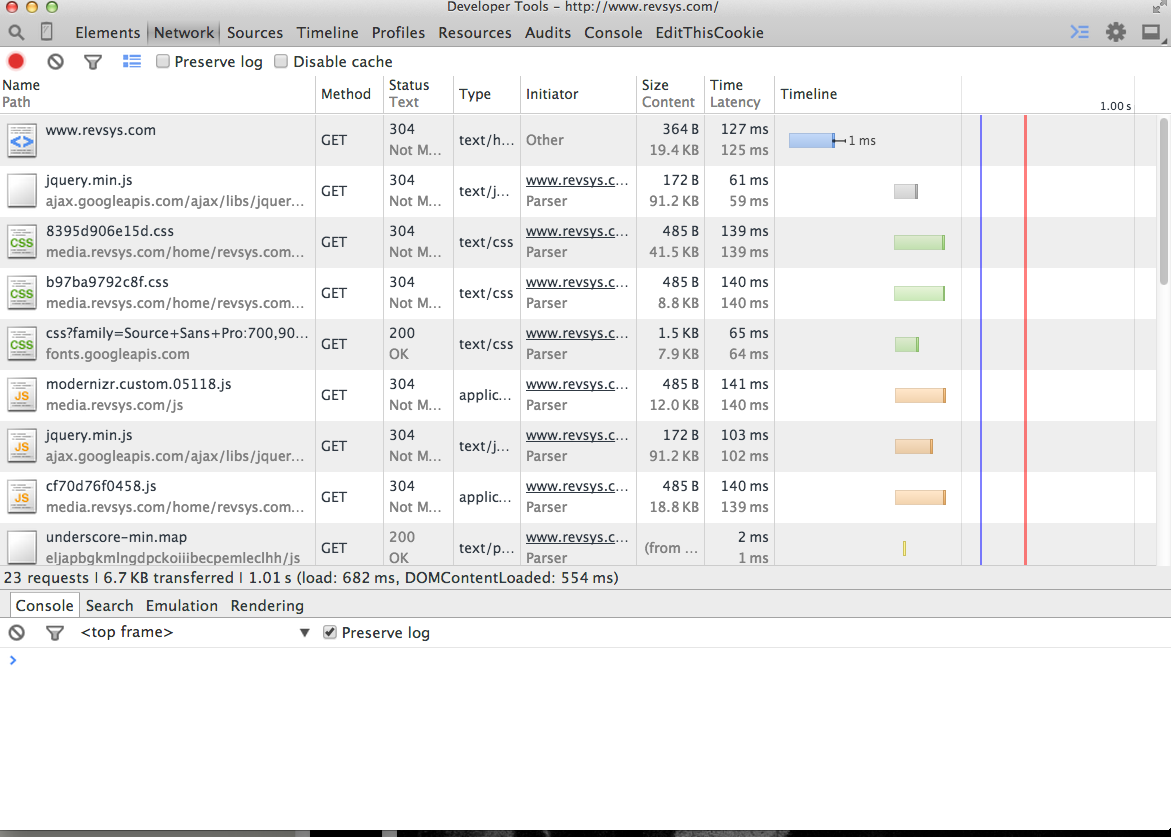
Chrome Developer Tools is built into Chrome. All you need to do is browse to your site. Right click on the page you want to check out, go down to Inspect Element and it launches. Click over to the Network tab and reload your site to see a fine grain break down of of how long each asset on your page impacts the performance. The little colored graphs on the right show you graphically how long things took. As you can see in this image, many of the items are vertically aligned, which means they were downloaded in parallel.
The Timeline and Profiles tabs in DevTools are also useful to see how well your JS and other "client side" work such as repainting are impacting how your page renders.
Finding Slow in Databases
More often than not your performance bottlenecks are going to be with your data store and not your code or anything we've been talking about in previous days. What data store is used most often? Your database of course.
django-debug-toolbar
If you're using Django, one quick way to find slowness is to use django-debug-toolbar as you write your code. If you aren't already using this, start. It's an absolute must have tool for any Django developer. One of the tabs of information it provides is the SQL queries being generated.
What you want to do is keep an eye on the number of queries being executed. Does the count stay low, say under 20-30 queries and relatively static no matter the arguments or data being returned? If so you likely need to dig a bit deeper to find the ultimate source of your problems.
EXPLAIN
The simplest way of finding performance issues with your database is to look
at the slower aspects of your site and analyze the queries being performed.
For PostgreSQL you want to use the
EXPLAIN ANALYZE command to see how PG goes about finding your
data.
revsys.com=# EXPLAIN ANALYZE select * from blog_post WHERE id=12;
                                                         QUERY PLAN
----------------------------------------------------------------------------------------------------------------------------
 Index Scan using blog_post_pkey on blog_post  (cost=0.00..8.27 rows=1 width=965) (actual time=0.979..0.981 rows=1 loops=1)
   Index Cond: (id = 12)
 Total runtime: 1.033 ms
(3 rows)

revsys.com=#
As you can see here PG is using the 'blog_post_pkey' index which makes looking up a single blog post stupidly fast at 1.033 milliseconds. Your mileage will definitely vary here! To learn more about tuning individual queries and reading the about EXPLAIN gives you, check out Using EXPLAIN on the PostgreSQL wiki.
pgBadger
Another technique that isn't used often enough, is to look at the volume of queries over time. We do this by configuring the database to log EVERY SQL query issued to another server, via syslog. We do this to avoid incurring the log file I/O on the database itself. This would not only skew our results, but degrade the performance of our production database which is what we're trying to avoid.
Collecting up all SQL queries over time allows us to:
- See the aggregate volume of particular types of queries
- Spot easy caching opportunities in our code
- Reduce overall system pressure
Once we've collected up some useful period of time, a couple of days or a week for example we can run it through a great tool called pgBadger. You can see an example report here.
The reports you want to be focusing on however are these three:
The first shows you the query patterns that consume the most time in your system as a whole. You'll definitely want to see if you can optimize or cache the results of these queries. The second, most frequent queries, are usually good candidates for caching. Keep in mind, by caching we're not saying for 30 minutes or an hour, often caching certain frequently requested data for even as little as 1-5 minutes can yield a significant speed up to your app. The third and final report is of the slowest individual queries. These are often cron jobs or other one off processes and can usually be ignored, but if you spot any non-batch type queries in there they may be prime candidates for some optimization.
Python Code
So you've done all of that and your code is still slower than Santa running the 50 yard dash? Then it's probably time to put down the milk and cookies and dive into your code.
The tool you're going to want to reach for is the Python profile modules in the standard library. You run these over your code as it executes and it shows you where all of the time is spent in your application logic.
You then look over the slower sections and try to find ways to do less work by caching or removing unnecessary operations. Or find ways to accomplish the task at hand using more efficient means, which might include a different data structure or algorithm.
Doug Hellman, in his Python Module of the Week series, covers profile, cProfile, and pstats in detail so we won't rehash that here.
Commercial Tools
There are probably other commercial tools out there which are awesome, but the only one we have any real experience with that we find useful is New Relic. You install and use a New Relic agent with your Python/Django code and it collects up detailed information on basically everything. Code execution, remote API calls, database transactions, you name it. It can get pricey, but the ROI is pretty easy to see between developer/ops time spent finding slowness and the savings you'll get in server resources. It's certainly worth taking for a spin.
Merry Monitoring!
We hope we were able to show you a new tool for your arsenal to help find the slow in your apps today. Happy Holidays from all of us at RevSys!